HTML Drawing With Canvas
As you may already know, there are two ways of creating graphics in HTML. One of them is Scalable Vector Graphics (SVG), and the other one is Canvas. We previously created a tutorial about SVG. Now we are going to learn about Canvas. In the SVG tutorial we learned how to draw some geometrical figures in HTML. Now we are going to learn how to draw using canvas. We can draw most graphics in SVG and canvas. Although in Canvas we need some JavaScript, there are many other things besides drawing that we can do with canvas. We are going to learn most of them in this tutorial. Let us start learning.
Drawing In the Browser
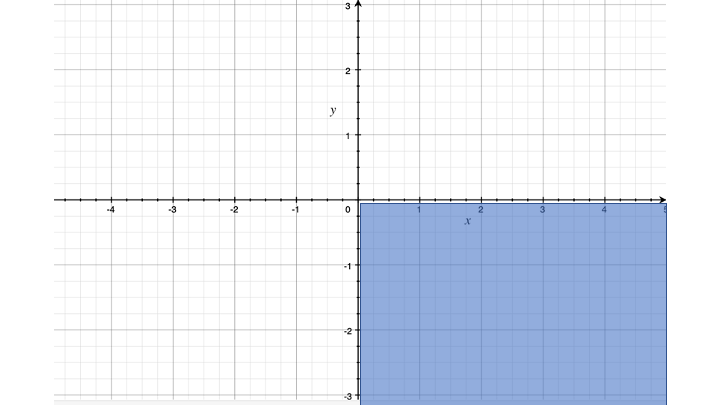
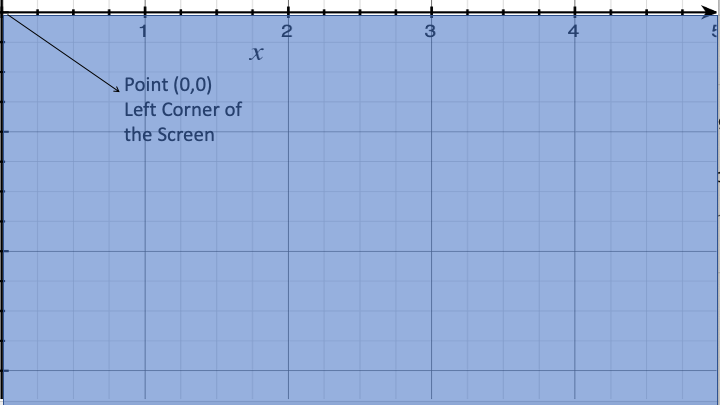
As we could see in the SVG tutorial, to Draw in the browser we implement the cartesian system. Although we use it in a different way. The cartesian system in the web uses the positive X axis and the negative Y axis as the screen. The point (0, 0) is the left top corner of the screen, and the numbers on the Y axis are not considered negatives. As we can see in the two images below. I assume you saw it in the SVG Tutorial. In case you did not see it, I show that to you again.
The Canvas HTML tag
In order to start drawing in HTML with canvas we need the HTML <canvas> tag. This tag is compatible with most modern browsers. Once we place the canvas tag in our HTML we will not see any difference. That is because the canvas tag is the container for our graphics. We can use some attributes for the canvas tag. The most used attributes for canvas are the width, and height. That is because the width of a canvas is set by default to 300px, and the height is set at 150px. Besides the width and height attributes, we can also use attributes for styling like id and class We show you brief example below of an empty canvas. We added some style so you can see how it is. In case we would not add any style you would not be able to see it.
Canvas Context
Once we create an empty canvas and set their attributes, we need to add some scripting. We first start adding the canvas to our script using the document.getElementByID function. Then we get the canvas context as a new element. We make all changes to canvas through the context. We use the function getContext() in order to get our context. In this tutorial we will add the context for most examples as ctx. As Canvas is a 2d drawing environment we will add the 2d parameter to our function. The following example shows how to initialize canvas in JavaScript.
let myCanvas = document.getElementById('my-canvas'); // If the Id of the canvas is set to my-canvas

let ctx = myCanvas.getContext('2d');
We can also embed them into a function; but in this tutorial we are going to use straight into the script. It’s up to you if you want to set up a function as a good practice. We are only going to show you how to embed the context into a function though we will barely use it.
function draw() {
  var canvas = document.getElementById('my-canvas');
  if (canvas.getContext) {
     var ctx = canvas.getContext('2d');

     //Your Changes after getting the context
}
Drawing Rectangles with canvas
Although in canvas we can create a lot of shapes and figures, the only ones that we can create using a single function are the rectangles. There are three functions that we can use to draw rectangles in canvas. They are fillRect(), strokeRect(), and clearRect(). As you may see in the example below, the strokeRect() function draw a rectangle through a line. The fillRect() function fills a rectangle with the fillStyle color. The clearRect() function draws a rectangle with a clear background. We can see that we can also use th strokeStyle() function in order to get a color line.
The example above shows how the mentioned functions to draw rectangles work. We just need to call the function in our script, then we specify the points for our rectangles. As you may know the first point is where the rectangle starts; the left top corner. The last point is the length and the height of the rectangle where X is the width, and Y is the Height.
Drawing All Other Shapes
As you could previously see, in canvas we have three functions to draw a rectangle. By now you should be thinking about how to draw the other shapes. In SVG you can draw shapes using a tag and some attributes. in canvas we draw all the shapes using a scripting language (JavaScript). In order to draw all the other shapes in canvas, we need the canvas path functions. There are also SVG paths which are very useful for SVG Graphics. In canvas we have many path functions which help us to draw canvas graphics easier; even while using JavaScript. We describe below the functions needed to draw with canvas using path.
Begin Path Function beginPath()
As its name implies, this function initializes the path that we need for our shapes. In other words this function initializes the drawing pen. We use this function along the canvas context that we described above. Well, we implement most canvas functions along the context. We show you a brief example below of how initialize the path in canvas.
let myCanvas = document.getElementById('my-canvas');

let ctx = myCanvas.getContext('2d');

ctx.beginPath();  //Initializing the Path
Moving the Path Function moveTo(x, y)
We have the ability to move the initialized path to a (x, y) point using the moveTo() function. That is simple and straight forward. We show you another example below of how to move the path to a point.
let myCanvas = document.getElementById('my-canvas');

let ctx = myCanvas.getContext('2d');

ctx.beginPath();

ctx.movePath(50, 50);  // Moves the path to the point (50, 50)
Closing the Path closePath()
Once we draw any path, we have the ability to close it using the closePath() function. The closePath() function creates a straight line from the ending point to the starting point of our path. Sometimes we do not need this function; but some others times it’s necessary.
let myCanvas = document.getElementById('my-canvas');

let ctx = myCanvas.getContext('2d');

ctx.beginPath();

ctx.movePath(50, 50);

ctx.closePath(); // Closing our Path
Stroke Function stroke()
The stroke() function is one of the functions we use to draw our shapes. This function is going to trace a line through the created path. Once we create our path and establish its points, we call the stroke() function to get the results.
Fill Function fill()
The fill() function is similar to the stroke() function. The only difference is that fill() function is going to draw the shape filling that with a solid color.
Fill and Stroke Styling
We also have two values which are responsible for the color of our shapes. These two values are fillStyle and strokeStyle. These two values set the color style as a string. They work with the fill() and the stroke() functions. We can set the colors using the color names, the RGB, or Hexadecimal values of any color in the following way.
let myCanvas = document.getElementById('my-canvas');

let ctx = myCanvas.getContext('2d');

ctx.fillStyle = 'green' // Fill shapes with color green when we call the fill() function
ctx.strokeStyle = 'red'  // Stroke a red line when we call the stroke() function
Drawing Lines in Canvas
By now we have seen many functions to draw using canvas. While drawing rectangles you could see how many of them work. Now you are going to see how they work in all the other shapes. You are also going to learn a lot of new functions to draw with canvas. One of the functions you are going to learn is the lineTo() function. This function as its name implies, draws a line between the starting point of our path and the given point we set. This function have two parameters which are the X, and Y values of the point where we are drawing the line. The example below is the most simple example of drawing a line. You can also see that we use the moveTo function to set a starting point.
The Line Width Value
The example above shows you how to draw a single line. You could also see in that example that we can set the width of the line using a numeric value. we don’t need to specify the unit; but the width is going to be in pixels. The line of the example above is a 10 pixels width line.
Drawing a Triangle
We can also draw triangles using some lineTo() functions. The following example shows you how to draw a triangle using two lineTo() functions and closing the path using the closePath() function. Now you can see how some of the functions we described above are implemented.
Drawing Circles with Canvas
There are two functions that we can use to draw arc in canvas. The same functions are used to draw circles because circles are arcs with a different ending angle. The two functions that we can use to draw arcs are the arc() function and the arcTo() function. In this tutorial we are going to use only the arc function. Although below we show you the description of both functions.
let myCanvas = document.getElementById('my-canvas');

let ctx = myCanvas.getContext('2d');

beginPath();

ctx.arc(x, y, radius, startAngle, endAngle,  [counterClockWise)); // Arc Function

ctx.arcTo(x1, y1, x2, y2,  radius);  // ArcTo Function.
You can see the description of the two functions to draw circles above. The parameters of these functions are different but they are straightforward. The arc function has six parameters. the first two values are the point (x, y) where the center of the arc is placed. The third parameter is the radius of the arc. The fourth and fifth values are the starting angle and the ending angle of the arc. Most times the starting angle is 0. If we are going to draw a whole circle the ending angle is 2π. As you may know in JavaScript we use Math.PI. The sixth Parameter is a boolean value. That value is clockWise or counterClockWise. That value is optional; but it denotes the direction of the arc. The arcTo function is clear. It draws an arc using an starting point, and ending point, and the radius. We provide an example below of a circle drawn using the arc() function.
The above example shows you how we could draw a circle using the arc() function. We could fill the circle and stroke it. The example below is going to show you how we can move the Path using the moveTo() function and create some more arcs. The following example is a happy face. In case you want to see the drawing lines you don’t need to use the moveTo() function; you can only continue drawing the other circles.
Evenodd Parameter
The example above shows a happy face drawing several arcs using the moveTo() function. We still can see some of the remaining moving line because we did not use the exact point in the moveTo function. You can try to clear the remaining of the line by subtracting or adding some numbers to the point in the moveTo() function. Something else that you can see is that the fill() color is also in the eyes. While using a path the fill and stroke color are going to be the same for the whole path. In order to avoid that we can use the evenodd parameter in the fill function. Using the evenodd parameter we can set a new fill color to any closed part of the path. below we show you the same example with a different color in the eyes using the evenodd value as parameter for the fill() function.
Multiple Paths
Using the evenodd parameters sometimes can be tricky and cause you some confusion. In order to avoid that, in canvas we can begin the path multiple times to use different fillStyle and strokeStyle values. No matter if you are going to use one path inside the other; remember that canvas works with the points. The example below shows you that we can begin a path and draw inside the others using different colors.
Canvas Line Cap
A few examples above we could see how to draw lines using canvas. Once we draw a line we have the ability to set a line cap. A line cap is the ending point of the line. There are three values that we can set as a line cap. we have the square value, also the butt value, and the round value. The square and butt are similar, they will only increase or reduce the line cap. The rounded value is the most different one because that one is going to round de ending point of the line. The following example shows you what is the result of the three canvas line cap.
Canvas Join Line
One of the first shapes we created using canvas was the triangle. As you could see in the triangle there are three joining lines. In canvas we also have the ability to set line joins differently. There are also many types of line joins in canvas In order to add different line joins we only need to apply the lineJoin values for our lines. As the lineCap value, the lineJoin also has three different values. These three values are bevel this value fills an additional triangular area between segments. Another value is the mitter, this value extends the connecting edges of the line. The other value is the round value, this value rounds the corner of connecting segments. The following example only shows you the round value. You can try the others to see the difference. Only need to change the value.
Canvas Curves
Although we have the arc function in canvas, we also have the possibility to draw only a curve. There are two types of curves in canvas They are the Bézier curve, and the quadratic curve. In order to draw these curves the only thing we need to do is to call their function and set the parameters. The only difference between quadratic curve and Bézier curve is that quadratic curves have only one control point, while Bezier curve have two. Their functions with parameters are quadraticCurveTo( cp1x, cp1y, x,y) and bezierCurveTo(cp1x, cp1y, cp2x, cp2y, x, y); where cp are the control points. We provide you another brief example below of a Bézier curve. (This example is only for showing purposes, In professional design you need to dive deeper in curves)
Canvas Shadow
We can also set a visual shadow to any canvas shape. There are many values that we can use to set the shadow inn canvas. These values are the shadowOffsetX, the shadowOffsetY, the shadowColor, and the shadowBlur. The shadowOffsetX and shadowOffsetY are numbers that take off a shadow from the original shape. They translate some units off their X and Y points. The shadowColor is straightforward; this value set the color of the shadow. We also have the shadowBlur value; this value sets a blur effect on the shadow.The example below shows the shadow of a rectangle using the mentioned values.
Canvas Gradients
Linear Gradient
In canvas we have the ability to fill our shapes with gradients. There are two types of gradients in canvas. The first type of gradient is the linear gradient. In order to create a linear gradient we only need to create a variable and implement the function createLinearGradient(). The function needs four parameters; these parameters are two (x, y) points. The function should be like createLinearGradient(x1, y1, x2, y2). Once we create the gradient we need to add color stops using the function addColorStop(). The addColorStop() function has two parameters. The first parameter is the position from 0 to 1 where we want to add the color stop. The second parameter is the color value. We can use color names, RGB values , or Hexadecimal values. We show you a brief example below about linear gradients.
Radial Gradient
Radial gradients are different than linear gradients. Their main difference is that radial gradient use two radiuses as reference, and the result is circular. The syntax for the function to create a radial gradient is createRadialGradient(x1,y1, r1, x2, y2, r2). You can also add the color stops with the addColorStop() function. The result would be similar to the one of the example below. In case you want to change the flow direction of the gradient, you need to change radius and points.
Canvas Image Patterns
We can also fill our content with patterns using canvas. To create a pattern is quite easy. We only need to create an image using the Image() function for javaScript. Then we create the pattern in canvas with the function createPattern(). After that we proceed to fill our context using the fill() function. The createPattern function has two parameters. The first parameter is the name of the image we are going to use. The second parameter is a string containing the pattern action. There are there actions for patterns. They are repeat, repeatX, and repeatY. The repeatX action is going to repeat the image horizontally, repeatY is going to repeat image vertically, and the repeat is going. to repeat the image horizontally and vertically. We show you another brief example for patterns. In case you want to see the image repeated more times, you need to resize using JavaScript.
Drawing Text with canvas
The term drawing text sometimes can be confusing. That is because we write text; no draw text. In canvas we can draw text by just setting a font to the context. Then we can call the function fillText() or strokeText(). These two functions have three parameters. The first parameter is the string of the text that we are drawing. The second and third parameters are the X and Y coordinates of the point where we are placing our text. The example below shows you how to draw text in canvas. That’s really nice.
Conclusion
Here you got enough information about canvas drawing. Even though we have a lot more of things to do with canvas. I am not sure if you saw our CSS Animations tutorial; In canvas we also have animations. We are working on a tutorial for more things that we can do with canvas including animations. Thanks for reading our post, We hope you enjoyed and learn a lot about canvas in this post. You can find a lot more of information about canvas in the Canvas MDN Tutorial. We also got some graphics from Pixabay.