Scalable Vector Graphics
There are two main ways to draw in HTML. One of them is canvas, and the other is scalable vector graphics (SVG). To draw with canvas we need to use some JavaScript to complete our code. While to draw with SVG we only need the HTML code. This tutorial only covers SVG. Although we are going to learn about canvas soon. Let us start learning.
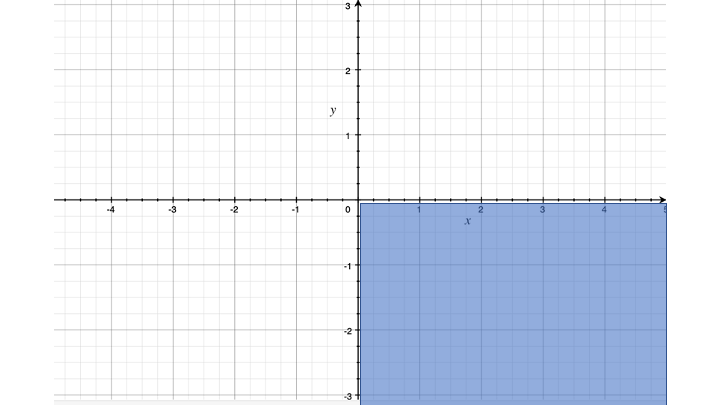
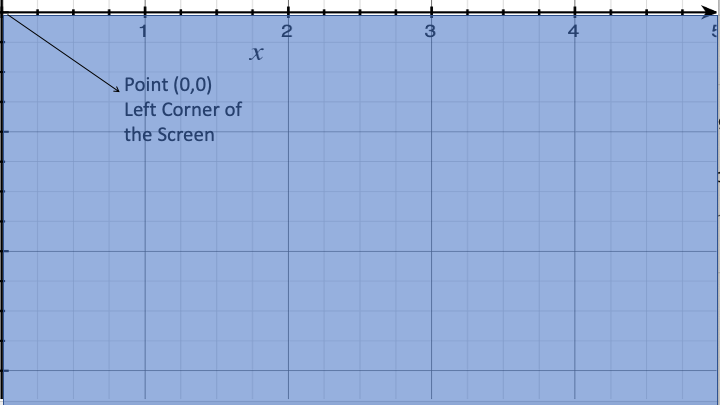
To create graphics with both SVG and canvas we need a cartesian coordinates system. In SVG this system is going to be slightly different. As you may already know, in a regular system you have the X axis and the Y axis. The center is the point (0,0). In SVG we also start from the point (0,0). The X positive axis and the Y negative axis is going to be the left corner of the screen. For that reason the points of the Y axis are going to be to the lower part of the screen. They won’t be negative.
Start Drawing with SVG
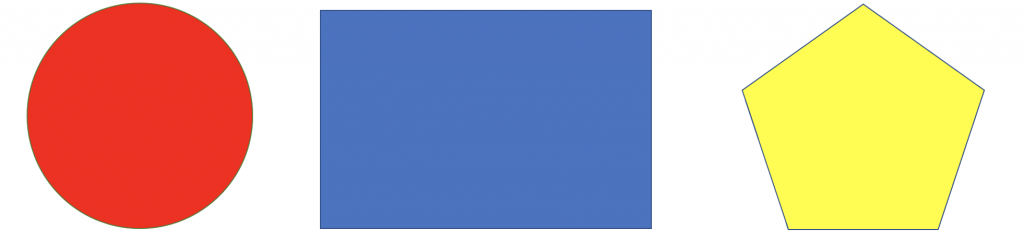
Scalable Vector Graphics are based on XML. We can use them in HTML by only creating an SVG tag. The SVG tag serves as container for SVG graphics. We use attributes to specify its heigh and width. As you may know there are many styling units In web development. SVG uses pixels as default; we don’t need to specify pixels in the values because the system will read pixels if we don’t specify any unit. The most used shapes in SVG are circles, ellipses, lines, rectangles, and polygons. Now let us start with some examples about SVG graphics. For all SVG graphics we can use the “stroke” attribute to draw the line. We specify a color for the line in the attribute. We can also use the “fill” attribute with a color value to fill the shape with the color.
Drawing Circles
We firstly will start drawing SVG circles. To draw any graphic in SVG is really simple and straightforward. As we said above the SVG tag is the container. Inside the SVG we create the graphic we desire. In this case we are going to create a circle using the circle tag as a child of the SVG tag. Then we can specify the attributes of a circle. The main attributes of a circle are the “CX” that is the center on the X axis, also the CY that is the center on the Y axis. In a circle we also have the radius “r” that is the size of the radius for the circle. The example below shows how to draw a circle in SVG.
Drawing an Ellipse
We can also create ellipses in SVG. They are similar to circles with the only difference that they need two radios. They need a radio for the X axis “rx”, and a radio for the Y axis “ry”. Below we show you an example of an ellipse using SVG. Also note that we have the “stroke-width” attribute; that is for the stroke line width.
Drawing Lines
It’s also possible to trace a line using SVG graphics. We can trace a line with SVG by only using the line tag in the SVG. As you may know you need to set some attributes for a line in SVG. Attributes for lines are different. For lines we only need to set the X and Y values. X1 is the starting point for the X axis while X2 is the ending point. The same with the Y axis, Y1 the starting point, and Y2 the ending point. As you may already know, we use the stroke and stroke-width for the line color and width. We show you another brief example below about drawing lines in SVG.
Drawing Rectangles
We can also draw rectangles with SVG. To draw. a rectangle is very easy. We only need to apply the “rect” tag to SVG. After applying the tag we need to set several attributes. The “x” attribute is the X position of the rectangle while the “y” attribute is the Y position of the rectangle. We also need to specify the width and the height of the rectangle with the “width” and “height” attributes for rectangles. There is another example below showing you how to draw rectangles in SVG.
Rounded Corners
We can also add rounded corners to rectangles. It’s very easy to do it. To add rounded cornes to rectangles we only need to add the “rx” attribute to the rect tag. The “rx” attribute is the radius of the X value. You can see the transform of a rectangle in the example below.
Drawing a Polyline
The term “Polyline” can be unknown for many people. A polyline in SVG is nothing else than a line created by a set of points. The polyline forms an open shape. The ending point does not need to be connected to the starting point. We can add as many points as we want. To create a polyline is very simple. We only need the “polyline” tag. Then we add the points attribute. After that we set as many points as we want. It could result in a weird shape. For that reason we should know where to set the points. Remember, points are in the form of (X, Y). You can see another example below about polylines.
Drawing Polygons
We can also draw polygons using SVG. Polygons and polylines are similar. Their only difference is that poly lines are open and polygons are closed. The first point of a polygon is connected to the last. Also, you need to know where to set your points, because you can create some weird shapes. There is a very useful online tool to create polygons in SVG. That tool is Clippy and is very useful to create the shape you want. Clippy works more with percentages instead of pixels, but the result is the one you want. Here we show you another example about polygons in SVG.
The View Box
In all the examples we created above we did not use the view box. In many cases is necessary to use the view box. To add the view box to SVG we only need to add the “viewBox” attribute to our SVG. The view box contains four values. They are the “min-x”, “min-y”, “width”, and “height”. Be aware they are in percentages not in pixels.They are also in the mentioned order.
<svg viewBox ="0 0 100 100">

<!-- Your Code Here -->

</svg>
The “g” Tag <g>
The “G” tag <g> serves as a container for many SVG Elements. If we want to add more than one SVG element to the same container we use the “g” tag in the SVG. Inside the “g” tag we can create as many “SVG elements as we desire. Here we got another example about the “g” tag.
Conclusion
Here we have the most basic shapes in SVG graphics. They are very useful while dealing with graphics in HTML. Also if you are. going to learn CSS Animations you could need a lot of SVG graphics. We are going to learn about animations in another tutorial. We can find more information about SVG Graphics in their MDN section. Thanks for visiting Moe’s Link We hope you learn a lot in this tutorial.